Our Solution
Our Solution
Elyx, the Cloud platform that automatically manages your utility bills.
Our Solution
Elyx, the Cloud platform that automatically manages your utility bills.
A dynamic and flexible solution for all the market needs
Digitization
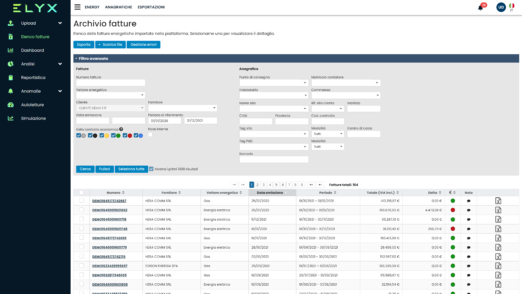
It allows you to automatically retrieve and import energy invoice data directly from the supplier’s PDF (including scanning). Invoices belonging to different energy carriers can be managed (methane gas, electricity, diesel, LPG, district heating and cooling) and is able to collect the following information:
-
- Meter registry
- Readings and consumption
- Details of utility billing
Digitization
It allows you to automatically retrieve and import energy invoice data directly from the supplier’s PDF (including scanning). Invoices belonging to different energy carriers can be managed (methane gas, electricity, diesel, LPG, district heating and cooling) and is able to collect the following information:
- Meter registry
- Readings and consumption
- Details of utility billing
Control
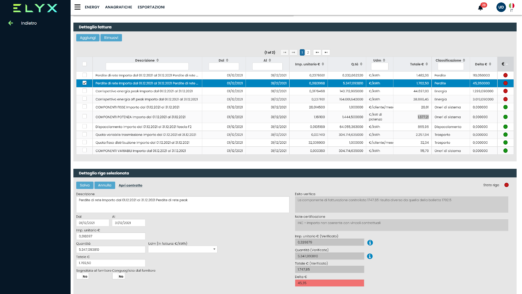
It allows you to automatically check the correctness of an energy bill extracted during the digitization phase. A traffic light will indicate the outcome of the control activities to highlight errors and anomalies relating to different aspects:
- Consistency with the supply contract
- Regulatory legislation (eg. ARERA for Italy)
- Comparison with the distributor’s consumption
Analysis
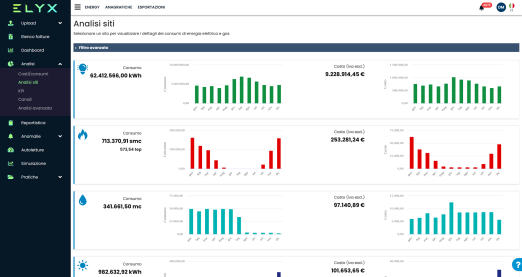
The data relating to costs and consumption are broken down monthly, for each delivery point and with a simple click you can find out how much has been spent or consumed for each individual property. The information obtained can be compared and analyzed on different levels (delivery point, building, cluster, customer). In particular:
- Comparison between available power and maximum used in the month.
- Reactive energy analysis and related penalties.
- Comparison of the raw material price with market indices.
- Comparison of billed consumption with other sources such as self-readings, data from the field, budget.
KPI
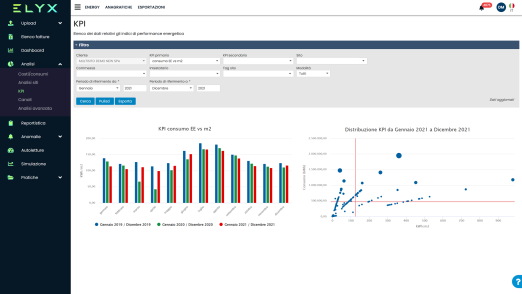
It allows you to define energy performance indices, customized according to the sector to which it belongs, to evaluate the behavior of each property in relation to the others. It helps the user, especially in multi-site situations, to highlight situations of abnormal consumption. In fact, various buildings can be compared on the basis of a single KPI or two KPIs can be compared to each other to perform even more in-depth assessments.
Report + Alert
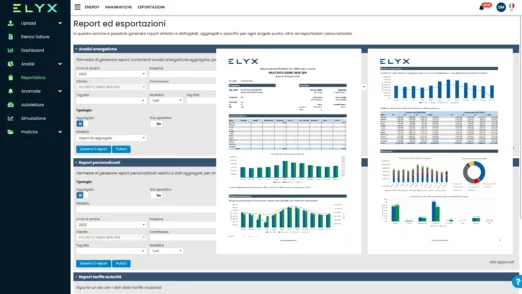
It allows you to generate customised reports, either aggregated or for a specific delivery point, and you can take advantage of an interactive dashboard to analyse all the data for each individual carrier in a visual and intuitive way.
Thanks to configurable alerts, it is possible to monitor situations such as:
- Abnormal costs and consumption
- Comparisons with self readings
- Detection of penalties and power peaks
Forecasting
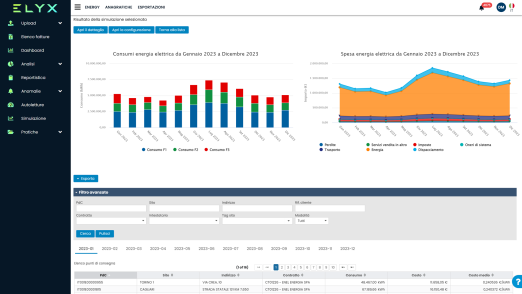
Thanks to the Elyx calculation engine, it is possible to generate energy expenditure simulations to cover various forecast scenarios, even in the long term, and to compare the data actually billed with the simulated ones. In particular:
- Calculation of the energy budget for the following year and any revisions.
- Generation of monthly allocations for the current month.
- Evaluation of energy expenditure according to the energy class, power change or evaluation of different supply contracts.